
THE 1983 LANDSAT SOIL-GAS GEOCHEMICAL SURVEY OF PATRICK DRAW AREA
SWEETWATER COUNTY, WYOMING
D.M. Richers, V.T. Jones, M.D. Matthews,
J. Maciolek, R.J. Pirkle, and W.C. Sidle
The American Association of Petroleum Geologists Bulletin V. 70 (July
1986), P.869-887
LIST OF FIGURES
Figure 1. Patrick Draw, Wyoming, study area, showing structure on Almond Formation (after Weimer, 1966). C.I. = 2,000 ft. AB = cross section shown on Figure 2, green = oil, red = gas, and yellow = Almond Formation.
Figure 2. Cross section of study area (after Weimer, 1966). Location shown on Figure 1. Green = oil, and red = gas.
Figure 3. False color composite Landsat Multispectral Scanner image, Rock Springs-Patrick Draw, southwestern Wyoming.
Figure 4. Composite Iineament analysis, Rock Springs - Patrick Draw, southwestern Wyoming.
Figure 5. Surface geologic map, Patrick Draw, Wyoming (after Roehler, 1977; Abrams et al, 1985).
Figure 6. Soil-gas sample locations and photolinear features in Patrick Draw study area, Sweetwater County, Wyoming.
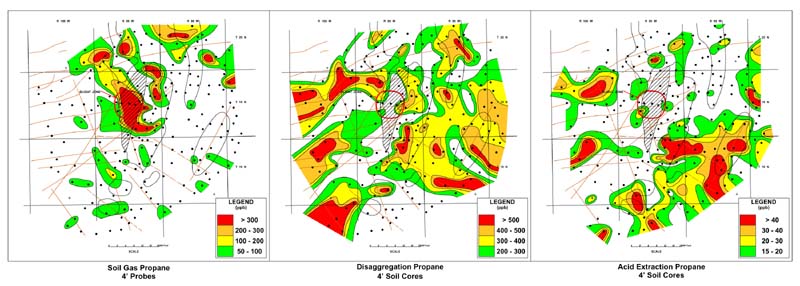
Figure 7. Data value and compositional plots with photolineaments for 4-ft (1.2-m) free soil-gas samples: (A) mean-scored C1+ data, (B) mean-scored C2+ data, (C) (C3/C1) x 1,000 compositional data, and (D) percent gas-wetness compositional data. Corner numbers show longitudes and latitudes.
Figure 8. Data value and compositional plots for 4-ft (1.2-m) disaggregate soil-gas samples, Patrick Draw, Wyoming: (A) mean-scored C1+ data, (B) mean-scored C2+ data, (C) (C3/C1) x 1,000 compositional data, and (D) percent gas-wetness compositional data. Corner numbers show longitudes and latitudes.
Figure 9. Data value and compositional plots for 4-ft (1.2-m) acid-extraction soil-gas samples, Patrick Draw, Wyoming: (A) mean-scored C1+ data, (B) mean-scored C2+ data, (C) (C3/C1) x 1,000 compositional data, and (D) percent gas-wetness compositional data. Corner numbers show longitudes and latitudes.
Figure 10. 65-nm fluorescence anomalies in soil samples, Patrick Draw, Wyoming. Corner numbers show longitudes and latitudes.
Figure 11. Thematic Mapper Simulator image of Patrick Draw area showing spectral anomalies.
Figure 12. Relationship between sample values and distance from linear feature for mean-scored ethane, all data.
Figure 13. Hypothetical fracture model. (A) Plan view projected. (B) Fracture frequency plotted against distance perpendicular to lineament center. (C) Projected hydrocarbon magnitude plotted against distance perpendicular to lineament center.
Download Poster (PDF Format, 4.4 MB)
ABSTRACT
The Geosat test site at Patrick Draw, Wyoming, was resampled during the summer field season of 1983, to conduct a more detailed soil-gas survey on and around the area's producing fields. The results of this study agree with the 1980 Geosat assessment that the faults and fractures visible as linear features on satellite and aircraft imagery provide paths for active microseepage of hydrocarbons from depth to the near surface. This association is particularly true near the earlier described "blighted sage zone," where extensive resampling reveals a much wider area of anomalously high free soil-gas values and fluorescence than was previously reported.
Discriminant analysis suggests that the geochemical seepage signature found over the fields differs statistically from that present for adjacent areas of no known production. This observation was found to be true for all three soil-gas techniques used in this study.
Anomaly patterns appear to be related to the type of soil-gas sample studied. Data obtained from shallow free soil-gas samples reveal that direct anomalies, controlled by faults and fractures, formed over production, whereas data obtained from samples treated by acid-extraction or thermal/mechanical disaggregation techniques exhibit magnitude lows over the producing areas. Such patterns indicate halo features around the composite producing areas. At present, this conflicting behavior cannot be explained.
INTRODUCTION
The Geosat Committee conducted a near-surface soil-gas survey over the Patrick Draw field, Sweetwater County, Wyoming, during the summer of 1980 (Richers et al, 1982). Based on the results of that survey, Gulf Research and Development Company, in cooperation with the Geosat Committee, conducted a follow-up survey during the summer of 1983.
This follow-up survey was designed to test and compare four different surface geochemical techniques used at Gulf Research and Development Company. These techniques are (1) a shallow (3-4 ft or 0.9-1.2 m) probe technique, which samples free gases in the soil by applying a slight vacuum (Matthews et al, 1984), backed up by a deeper (12 ft or 3.65 m) free-gas technique, used to calibrate the 4-ft (1.2-m) probe method, (Jones and Drozd, 1983); (2) a disaggregation technique, in which shallow (4 ft or 1.2 m) soil plugs are subjected to thermal and mechanical extraction in a ball mill (Richers, 1985); (3) an acid-extraction technique, in which clay-size particles, separated from the soil, are attacked by a mild acid to release adsorbed hydrocarbons (Horvitz, 1972, 1985); and (4) a fluorescence technique, in which soil samples are subjected to organic solvent extraction into hexane, followed by fluorescence of the extract with ultraviolet light (Horvitz, 1985). The objective of this research was to determine the relative amounts and spacial locations of the free, loosely bound, and tightly bound hydrocarbons in the soil overlying the producing fields in the Patrick Draw area. On the basis of the previously reported "macroseep" over Patrick Draw field (Richers et al, 1982), this area was recommended for additional study.
A secondary objective of the follow-up survey was to determine whether any of these soil-gas geochemical techniques could statistically define an area as "on production" versus "off production." To this end, the sample area was expanded in the second survey to include not only the Patrick Draw field, but also West Desert Springs field, Desert Springs field, and Table Rock field (Figure 1). In addition, coverage was expanded westward several miles from these features so we could compare the geochemical signatures of producing areas with those of nonproducing areas.
GEOCHEMICAL THEORY
The premise for geochemical soil-gas surveys is that hydrocarbon accumulations
leak varying quantities of those hydrocarbons to the near surface. Furthermore,
such leaks are commonly large enough not only to be detected in the near
surface, but also to be distinguished from the minute quantities of background
hydrocarbons that seem to be present in most near-surface samples. Finally,
the composition of these microseeps accurately describes the reservoir
hydrocarbon composition (i.e., oil, mixed or condensate, or gas) present
at depth.
The first recorded hydrocarbon soil-gas studies were reported by Sokolov
(1933) and Laubmeyer (1933). This early work, as well as other early techniques
described by Teplitz and Rogers (1935) and Horvitz (1939, 1959, 1972,
1985), was often cumbersome and difficult to perform, requiring large
sample volumes to obtain reasonable results. With the advent of gas chromatography
and the flame ionization detector (FID) in soil-gas detection and analysis,
the effort required to detect minute levels of gases present in soils
has been greatly reduced. Using these modern analytical methods, we can
distinguish between signals that represent normal, ambient levels of soil
gases, and signals derived from leaking subsurface accumulations and source
rocks. Extensive research at Gulf Research and Development Company has
repeatedly demonstrated that both "free" and "sorbed"
gas microseeps usually have compatible information about their associated
reservoirs (Teplitz and Rogers, 1935; Janezic, 1979; Jones, 1979; Mousseau
and Williams, 1979; Drozd et al, 1981; Jones and Drozd, 1983; Price and
Heatherington, 1984; Richers, 1984), even including artificial underground
gas generation and storage (Jones and Thune, 1982; Jones, 1983; Pirkle
and Drozd, 1984).
Although predicting the presence of economic hydrocarbon accumulations
at depth is risky (as distinguished from predicting the mere presence
of source rocks and sub economic accumulations), early researchers often
proposed that diagnostic patterns occur in the near-surface geochemical
signature associated with oil and gas reservoirs. Two end-member models
have emerged over the years: central lows (halos) and central highs (chimneys).
In most studies (as in this one), the anomaly pattern is best described
as "spotty," which could be a mixture of the two end members.
Our combined experiences have been that the exact shape of the surface
patterns does not usually resemble the field outline. These patterns may
occur directly over their subsurface source, but they also can appear
horizontally displaced in areas with inclined bedding planes, listric
faults, or active groundwater flow. An assumption of simple vertical diffusion
is commonly made where subsurface geologic information is unavailable,
but such an assumption is not always appropriate and may distort the interpretation.
Where subsurface information implies a horizontal displacement has occurred,
an attempted correction for this displacement should be applied to the
interpretation.
In the study area of this paper, we do not believe significant horizontal
displacement exists. The bedding dips are generally low, whereas the fractures
are believed to have high dips. Although it is not the intent of this
paper to judge the validity of the end-member models, the results of this
study, as well as extensive unpublished results, suggest that surface
prospecting techniques, carefully applied and combined with sound geologic
reasoning, can enhance the explorationist's prospect of finding economic
hydrocarbon accumulations.
GEOLOGIC OVERVIEW
The Patrick Draw area has been undergoing economic development since
the 1950s. The study area is on the eastern flank of the Rock Springs
uplift in Sweetwater County, Wyoming (Figure 1).
Four major hydrocarbon accumulations are present in the study area: Patrick
Draw field produces oil and gas; Desert Springs field produces gas; West
Desert Springs field produces oil; and Table Rock field produces gas.
As shown on the east-west cross section in Figure 2, much of the production
in the area is from reservoirs formed as stratigraphic traps in the Cretaceous
Almond sandstone, although the Table Rock field is an anticlinal trap
(Weimer, 1966; McCubbin and Brady, 1969). The uplift of the Rock Springs
anticline and the subsequent formation of potential stratigraphic traps
in the updip Almond sandstone occurred during the Laramide. Concurrent
with this uplift and deformation was the formation or reactivation of
many extensional features, which are visible as linear features on Figures
3 and 4. The study area and its relationship to the geography of southwestern
Wyoming are outlined on Figure 3. Linear features, which were interpreted
from this Landsat scene, a Seasat L-band radar image, the Thematic Mapper
Simulator (TMS), and aerial photographs, appear on the Landsat image shown
in Figure 4. These linear features are of particular interest in soil-gas
surveys because they commonly reflect faults and joints that act as conduits,
allowing gases to escape from subsurface reservoirs and source beds to
the near surface. The earlier 1980 Geosat soil-gas survey of Patrick Draw
showed that several lineaments transecting the study area preferentially
aided micro-seepage (Richers et al, 1982).
The main production in the area is from the barrier-bar sands or nearshore
deltaic sequences of the Cretaceous Almond Formation. The updip stratigraphic
pinch-out of these facies provides the trapping mechanism for all but
Table Rock field, whereas Desert Springs field represents the updip stratigraphic
equivalent of the Table Rock sand unit of the Almond Formation.
The Almond sandstone is a complex unit that represents several transitional
environments. The exposures of the formation on the Rock Springs uplift,
west of the study area, are subdivided into upper and lower units. The
lower unit consists of carbonaceous shales, coals, and minor lenticular
sand bodies (McCubbin and Brady, 1969). The upper unit, which is the main
reservoir facies of the area, consists of intertonguing shales and sands
deposited in nearshore and shoreline environments. The thickness of the
Almond Formation ranges between 600 and 700 ft (180 and 210 m) on the
Rock Springs uplift. Eastward (basin-ward) from the uplift, the Almond
sandstone intertongues with and is eventually replaced by the marine Lewis
shale and siltstone. These neritic units also cap the Almond Formation
at Patrick Draw because of the westward transgression of the Late Cretaceous
sea. The Lewis shales are a strong candidate for the source of the oils
in the Almond reservoirs. The Upper Cretaceous Fox Hills and Lance Formations,
which represent a regression of the Cretaceous sea immediately followed
by a transgression, overlie the Lewis formation. Directly above the Lance
Formation is a thick sequence of Paleocene shales, sands, and coals comprising
the Fort Union Formation. These coals are currently being mined in the
extreme western part of the study area by the Black Butte Coal Company.
Above this unit is the Eocene Wasatch Formation, which is characterized
by low-energy shallow lacustrine to swampy facies. This unit and the Fort
Union are exposed at the surface of the study area. Underlying the main
Almond reservoir sands is the Erickson Sandstone, which is a terrigenous
unit. These general stratigraphic relationships are depicted in Figure
2.
The surface geology is represented in Figure 5. The Wasatch and Fort Union
Formations are present at the surface over much of the area, although
the Luman Tongue of the Eocene Green River Formation crops out in the
southeastern part of the study area.
GEOCHEMICAL INTERPRETATION
The current study of the Patrick Draw area used four different types
of surface geochemical data: 4-ft and 12-ft (1.2-m and 3.65-m) free soil-gas
data, 4-ft (1.2-m) adsorbed (disaggregated) soil-gas data, 4-ft (1.2-m)
acid-extraction (Horvitz) soil-gas data, and 4-ft (1.2-m) soil extract
fluorescence data. With the exception of the 12-ft (3.65-m) data, which
had limited coverage, the area sampled was more than 324 mi2 (839 km2).
Sample locations and their relationship to mappable linear features are
shown in Figure 6. All samples were analyzed by FID-gas chromatography
to determine light hydrocarbon gas content (methane through the butanes).
Data listings are available from the writers.
Pertinent statistical information on gas concentrations for each of the
four data sets appears in Table 1, and compositional information is shown
in Table 2.
Shallow Probe (4-Ft Free Soil Gas)
The 4-ft (1.2-m) free soil-gas data were collected by inserting a probe
into the ground to a depth of about 4 ft (1.2 m). The probe consisted
of a thin (0.5-in. OD) rod with an inner (0.125-in. ID) collection tube.
A hand pump attached to the top of the probe was used to fill an evacuated
100-cm3 serum bottle to 1.5 atmospheres (22 psi or 152 kPa). The septum
on the bottle was then sealed with silicon cement to reduce the risk of
leakage. Because the hole in which the probe is inserted is made by a
portable slide-hammer punch, the overall weight of the sampling apparatus
is under 20 lb (9 kg). With such an apparatus, a single technician can
sample up to 40 sites/day in terrane such as at Patrick Draw, at an average
sample density of 1 sample/mi2 (0.4 samples/km2).
Magnitude
As depicted in Table 1, the range of values for the individual gases extended
from ambient atmospheric values to levels four orders of magnitude above
atmospheric. The macroseep area over the Patrick Draw gas cap in the "blighted
sage zone" exceeded 30,000 ppm (3%) by volume for both the 4-ft (1.2-m)
and 12-ft (3.65-m) samples. (The blighted sage zone was an area of stunted
or absent sage, as noted in Richers et al, 1982.) Displays for both data
value and composition plots for the 4-ft (1.2-m) samples overlain on mappable
lineaments are shown in Figure 7, which contains four individual plots:
C1+, C2+, percent gas wetness, and (C3/C1) x 1,000. In order to reduce
the number of figures required to show the magnitude data adequately,
the data were reduced to yield two maps. One map represents mean-scored
C1+ data (Figure 7A). This plot represents the sum of all the light saturated
hydrocarbon components from methane through the butanes. The second plot
(Figure 7B) shows mean-scored values for the C2+ data (C1+ minus the methane).
In both maps, the data are represented as,
score = 100% x (sample - mean)/standard deviation.
Hence, a sample whose value is equal to the mean has a score of 0.0%,
a sample whose value is the mean plus 1 standard deviation has a score
of 100.0%, and so on.
Eight 4-ft (1.2-m) free soil-gas samples had extreme values (several orders
of magnitude above the majority). These samples were collected near linear
features in the blighted sage zone and along a major linear feature crossing
the West Desert Springs field. The sites statistically represent a unique
class of microseeps in the area. Obviously, these samples would bias the
overall statistics because of their extremely high gas contents; therefore,
the means and standard deviations used in the magnitude plots of Figure
7A and B were calculated after excluding these samples. For computer contouring
purposes, the extremely high-value samples were assigned the maximum score
obtained from the lower value data and were remerged as one data set.
After such treatment, the 4-ft (1.2-m) free soil-gas data show high scores
over the Patrick Draw and West Desert Springs fields. A localized (single
point) high value also appears over the Desert Springs field. Paylor (1983)
reported high concentrations of clay over the Table Rock gas field. The
notable absence of high-magnitude free soil-gas values over this field
may result because this clay is present, if it indeed acts as a barrier.
However, the main Patrick Draw field represents an area of more active
and recent microseepage. Many examples have been reported for the alteration
phenomenon associated with hydrocarbon microseeps (Donovan, 1974; Ferguson,
1975; Donovan and Dalziel, 1977). In theory, the free-phase pore gas generally
measured by this shallow probe method could be effectively prevented from
reaching the near surface by an impermeable clay layer in the soil.
Extremely high values of 4-ft (1.2-m) free soil gas were noted in the
1980 Geosat study (Richers et al, 1982) in an area called the blighted
sage zone. This zone is an area over the gas cap of the main Patrick Draw
field where the sage is stunted or absent. The current study reaffirms
the presence of sites in the area with extremely high values, as well
as additional sites not previously sampled. In the current study, free
soil-gas values exceeding 30,000 ppm (volume) were recorded for both 4-ft
(1.2-m) and 12-ft (3.65-m) samples in the blighted area. Due to the limited
coverage of the deeper 12-ft (3.65-m) samples, they are only discussed
as support for the 4-ft (1.2-m) free soil-gas data. However, the 12-ft
(3.65-m) free gases accurately assess compositional information and, because
of their depth, are probably less affected by near-surface bias that may
occur with other techniques.
Some concern exists that the high-value sites in the blight zone are influenced
by current production practices at Patrick Draw field. Essentially, Patrick
Draw field is under-pressured, and operators reinject gas coproduced with
the oil to help lift the oil. R. B. Maynard (1985, personal communication),
who is familiar with the area, stated that about 3 bcf of gas is unaccounted
for since the reinjection practice was initiated. Obviously, such high
fluxes of free gas in the soil near fractures over the main Patrick Draw
gas cap lead us to conclude that much of the present-day signal could
be artificially enhanced by the escape of this reinjected gas. However,
B. Rock (1985, personal communication), in studying the sage in the area,
found evidence of extreme stress in the sage for more than 95 years. The
Patrick Draw field has only been in production since 1959. The general
consensus is that the leakage phenomenon probably existed prior to 1959,
but perhaps in a more limited way.
Therefore, production-enhanced seeps would use the natural, preexisting
fracture and bedding-plane channels that the original natural microseeps
used, although new avenues such as leaking well casings could add additional
paths.
Composition
Compositionally, the 4-ft (1.2-m) free soil-gas probe data (with the
exception of data from the eight anomalous sites) are extremely dry overall
(i.e., indicating gas). The compositional data for the 4-ft (1.2-m) free
soil-gas samples appear in Figure 7. Only (C3/C1) x 1,000 and percent
gas-wetness data are represented (Figure 7C and D, respectively). The
average compositional signal at Patrick Draw based on percent gas wetness
(100% x C2+/C1+), 1,000 x C3/C1, and C1/C2 does not accurately predict
the expected oil/gas signal of the area, although the 24 sites with methane
values greater than 4 ppm are oilier (Table 2). On these maps, areas of
dryness are represented in red, with progressively oilier areas grading
toward yellow and ultimately green. As shown, the percent gas-wetness
data are less dry in areas of higher flux. The (C3/C1) x 1,000 data do
not show such a relationship because the overall low values for C3 enhance
the dry signature. Data obtained with this technique showed values for
all gases to be near ambient in all but the blighted sage zone. The poor
compositional match of the 4-ft (1.2-m) probe data is inherent with this
technique, as explained by Jones and Drozd (1983). One should only rely
on probe compositional information in areas of high flux. The 12-ft (3.65-m)
data are generally more reliable because surface effects are reduced.
Patrick Draw field produces oil and gas (with the gas being reinjected),
West Desert Springs field produces oil, and Table Rock and Desert Springs
fields produce gas. Therefore, a mixed signal is expected (i.e., indicating
oil and gas, or condensate). Clearly, Table 2 shows that the free gas
sampled at depths of about 12 ft (3.65 m) are wetter (oilier), and the
4-ft (1.2-m) data (Figure 7) show that most of the area contains low amounts
of soil gas. The opposite observation would be expected in the blighted
zone because gas is reinjected. Possible explanations for the probe gas-composition
shift include atmospheric dilution of most of the free gas signal, or
effective overpowering of the signal by extreme fluxes of methane escaping
from the fields. Because the deeper 12-ft (3.65-m) free soil gas is oilier,
the most likely explanation for the low-value probe sites is dilution
by the atmosphere.
Dissagregate Soil Gas
Soil samples were collected from most of the study area using a power auger to drill a 3-ft (90-cm) deep, 3-in. (7.6-cm) diameter hole. A 2-in. (5-cm) (ID) stainless steel coring pipe was driven into the bottom of the hole, and a soil plug was extracted from a depth of about 4 ft (1.2 m). The soil plug was transferred into Ziplock storage bags for subsequent analysis in a laboratory at the base camp. These analyses were conducted by transferring a small split of the soil (typically 5 cm3) into a stainless steel cell fitted with a side arm and a septum. Two ceramic balls and water were added, bringing the airspace in the cell to 10 cm3. The cell was then sealed and agitated on a SPEX Mixer-Mill for 5 min to disaggregate the soil. The cell was placed in a controlled temperature water bath maintained at 90ºC for several minutes to help release lightly sorbed hydrocarbons. A locking gas syringe was used to extract a 1-cm3 aliquot of the gas in the cell's headspace. This aliquot was then injected into a FID-gas chromatograph designed at Gulf Research for hydrocarbon analysis. A two-person auger crew could typically sample between 35 and 45 sites/day. At this rate, the analysis crew could typically cycle through the probe and disaggregation samples with only a 1 to 2-day time lapse.
Magnitude
Statistical information about the data obtained on the gases using this
technique appears in Table 1. Overall, except for the areas of extreme
flux observed in both the 4-ft (1.2-m) and 12-ft (3.65-m) free soil-gas
data, site-per-site comparison of the two data sets revealed that the
disaggregation samples yield higher gas contents. Obviously, a few extremely
high free soil-gas samples, unless treated separately, can bias the statistics
radically.
Figure 8 shows the distribution of C1+ and C2+ data values and (C3/C1)
x 1,000 and percent gas-wetness compositional data for the dissagregate
samples. Areas having data with low values are concentrated over all but
one of the fields. Similarly, the mean-scored data with higher values
for both C1+ (Figure 8A) and C2+ (Figure 8B) appear to sporadically or
randomly rim the fields covered in the survey. This pattern results in
a faint halo around the fields. The central low area is essentially coincidental
with the high values of the 4-ft (1.2-m) free soil-gas data. This out-of-phase
relationship between the two data sets is unexplained.
Suggested explanations for the central low in disaggregation data are
reduced porosity directly over an accumulation (Donovan, 1974; Ferguson,
1975; Donovan and Dalziel, 1977), or the possible effective removal of
sorbed hydrocarbons by a phenomenon associated with the large amount of
free hydrocarbon gas flux. Possible explanations for such a phenomenon
include the solution removal of indigenous hydrocarbons by ascending acid
mineral fluids and removal by increased bacterial action, changes in the
sorptive capacity of the soils, or changes in soil pH created by the free
gas flux. This phenomenon has been noted over a propane storage cavern
where soils had recorded pH values of 5.5 or less and were virtually void
of sorbed gases, whereas free gas fluxes were high (Pirkle and Drozd,
1984). Where fractures are present, a high free-flux signal might be expected,
although the more pervasive adsorbed and absorbed signal would be reduced.
The occurrence of highs with one technique and lows with another is common,
and has been reported in other areas (Richers, 1984). The comparison of
Figure 7A and B (4-ft free gas) with Figure 8A and B (disaggregation)
shows the data to be almost 180º out of phase. Despite the apparent
inverse spacial relationships between the contour maps of these two data
sets, a site-by-site correlation is near zero.
Adsorbed soil-gas anomalies over Table Rock field may occur in part because
of abundant clay in the soil. Clay-rich soils would afford more sites
for absorption than would less clay-rich soils, and they would provide
more efficient seals for fractures that might extend from depth. Matthews
(1985) suggested that the presence of mechanical and thermally desorbed
hydrocarbons coupled with the absence of higher valued free soil-gas samples
over this field is evidence of a deeper, earlier diagenetic alteration.
In addition, sites with high values for data in the southeastern part
of the study area could also be influenced by the Luman Tongue of the
Green River Formation (Figure 5). Because of its high organic content,
soils derived from the Luman Tongue should exhibit high sorbed-gas values.
However, the occurrence of highs for this technique are generally proximate
to linear features mapped from Landsat, Seasat, and high-altitude photographs,
suggesting, in part, that measured gases are migrating from depth.
Composition
The average composition of the disaggregate soil-gas samples appear in
Table 2. This table shows that both the percent gas-wetness and the C3/C1
x 1,000 signatures predict a mix of oil and gas, and that they most closely
reflect the production of the area. The C1/C2 data suggest a slightly
dryer product than that shown by the 12-ft (3.65-m) free soil gas.
The areal distribution of the disaggregate soil-gas compositions is depicted
on Figure 8C (1,000 x C3/C1) and D (percent gas wetness). Generally, the
areas directly over the fields appear as intermediate (oil-gas mix), which
translates into (C3/C1) x 1,000 values above 20.0 and gas-wetness values
greater than 5.0%. Areas of higher values appear to be wetter, suggesting
that the signal is not changing randomly but, in fact, reflects either
subsurface sources for the hydrocarbons found in the surface or influences
of bed rock. In the southeast, this high wetness could reflect input from
the Luman Tongue of the Green River Formation; elsewhere, however, no
such influence should occur. Comparison of the diagnostic ratios for Patrick
Draw sites with numerous other areas lends support for using such ratios
to define the production at Patrick Draw. Another area where multiple
sampling techniques were recently used is Rose Hill, Virginia (Richers,
1984), where production is predominantly oil from shallow carbonate reservoirs.
The Rose Hill oil area was compared to a Devonian shale gas area in Allegheny
County, near Pittsburgh, Pennsylvania. The results of this study are given
in Table 3. As shown, both the free soil-gas and disaggregated signals
correctly distinguish between the Rose Hill oil field and the Devonian
shale gas. Previous studies indicated that most sorbed soil gas tends
to be oilier than 12-ft (3.65-m) free gas because of preferential loss
of methane caused by its low sorptive abilities (Jones and Drozd, 1983;
Richers, 1984). For the Patrick Draw area, therefore, an additional near-surface
source of methane may be present that slightly biases the sorbed-gas results.
Acid-Extraction Soil Gas
Acid-extraction hydrocarbon determinations were also made on the 4-ft (1.2-m) soil plugs collected in this study. The samples were shipped to Horvitz Laboratories in Houston, Texas, and the analyses were made using the method of Horvitz (1972).
Magnitude
Data value and composition plots for these analyses appear in Figure
9. Again, the data values have been adjusted to reflect mean scores rather
than raw concentrations. Figure 9A represents C1+ data, and Figure 9B
represents C2+ data. Comparison of these plots with Figure 8A and B shows
a high degree of similarity with the disaggregation data.
Again, as shown, a slight halo pattern could be suggested for the acid-extraction
data. In fact, with the exception of a few areas, the distribution of
data values is remarkably like that previously shown for the disaggregation
data set. The occurrence of a high over Table Rock field and the remainder
of the southeastern area perhaps reflects either the clay compositions
of the soils in this particular area (and hence a higher abundance of
active sites for the adsorbed gases) or some influence from the Luman
Tongue. The fact that both the acid-extraction and disaggregated data
sets appear so similar suggests that both analytical techniques are sampling
the same portion of gas in the soil. A "cleaner" signal might
be expected from the acid-extraction technique since it involves only
the clay fraction of the soil, whereas the disaggregate technique uses
a bulk soil sample; in fact, the intercorrelation among the individual
gases obtained from the acid technique were higher than those for the
disaggregated gases.
Composition
As expected, based on the similarity in data values, both the acid-extraction
and disaggregate techniques are compositionally similar. Table 2 shows
that the diagnostic ratios for these two techniques are similar and are
slightly gassier than the 12-ft (3.65-m) data.
Areal distributions of acid-extract compositional data appear in Figure
9C and D. Again, areas of higher concentration show the wettest signals,
suggesting that the signal seen reflects both bedrock effects and the
presence of subsurface phenomena. The (C3/C1) x 1,000 data are represented
in Figure 9C, and percent gas-wetness data are represented in Figure 9D.
Fluorescence Analysis
Most fluorescence values were exceedingly low (< 5 units), with only a few sites exhibiting measurable values. Nevertheless, the most significant values have been mapped and shown in Figure 10. Further, the soil fluorescence anomaly sites closely matched the highest value 4-ft (1.2-m) free soil-gas sites shown on Figure 7. Richers and Weatherby (1985) found that areas appearing as spectrally unique on a TMs image (Figure 11), produced by Geosat and Jet Propulsion Laboratory personnel using NASA's NS-001 spectrometer, coincided with fluorescence anomalies (365 nm) of soil samples collected from the area (Figure 10). This particular wavelength of fluorescence indicates that heavy hydrocarbon compounds are present. The high degree of correlation between the hydrocarbon microseep at Patrick Draw and the fluorescence anomalies is significant. The ability to detect indirect effects of microseepage, such as alteration of soil and/or vegetation, using airborne remote-sensing scanners appears possible.
PROPOSED FRACTURE MODEL
Richers et al (1982) noted that microseeps occurring at Patrick Draw
were located preferentially near linear features. Our study confirms this
association; in it, the average distance of the sample sites to a linear
feature was about 4,000 ft (1.2 km). The distance of sites for all methods
with C1+ and C2+ values greater than 1 standard deviation above the mean
averaged only 2,400 ft (0.72 km), with most of the high-value sites skewed
to even smaller distances from fracture zones. The few high-value sites
that appeared to fall farthest from the lineaments were, in fact, along
trend with linears that died out before visibly extending to those sites.
The affinity of high values with linear features is not surprising since
lineaments commonly represent zones of faulting or intense fracturing.
However, the relationship is not simple, as demonstrated by the combined
soil-gas data in Figure 12. We expected that all sites over a lineament
would have high values and that the scores would decrease proportional
to a site's distance from the lineament. Instead, we find that low sites
occur everywhere, and as the lineament is approached, the average and
maximum values increase. This behavior is easily understood by recalling
that linear features such as faults and regions of intense fractures are
fracture zones (as shown in Figure 13A) and rarely occur as a single plane.
The intensity of fracture disruption decreases from maximum near its center
out to the relatively undisturbed regional conditions (Figure 13B). Therefore,
a sample taken near the center of the lineament has the highest probability
of intersecting a fracture, and that fracture has the highest probability
of connecting to other fractures. Therefore, near the center, we expect
the highest scores (in connecting fractures), some intermediate values
(in fractures with poorer connectivity), and some low scores (in unfractured
areas between fractures). Farther from the linear center, the number of
fractures and their connectivity decrease, causing both the average and
maximum values to decrease until they blend with the ubiquitous regional
background values that are typical when fractures are not sampled by the
technique used (Matthews et al, 1984). This relationship is diagrammatically
shown in Figure 13C, which is a projection perpendicular to the lineament
trend of sample locations shown in Figure 13A. Note the similarity between
Figure 12 and Figure 13C.
When attempting to map fractures from aircraft and satellite altitudes,
it is difficult to define lineament locations accurately within distances
of several to even hundreds of yards. Those who have attempted to locate
linear zones on the ground from satellite imagery can readily attest to
this.
Workers must be very skilled when tying surface features back to linear
features seen on satellite images. Lineaments commonly appear on the ground
as subtle zones of topographic depressions (or elevations), areas of moisture
change in the soil, or even changes in vegetation type and character.
Therefore, soil-gas surveys are best performed using a tight grid, or
even small gridded clusters, to ensure sampling within the lineaments.
DISCRIMINANT ANALYSIS
The study of several distinct data sets in the Patrick Draw area offers
the opportunity to separate producing from nonproducing areas using a
statistical discriminant-analysis approach. Discriminant analysis was
performed on each of the soil-gas data sets using a linear distance function
for the five variables (methane, ethane, propane, isobutane, and normal
butane) to determine whether the sites were correctly reclassified as
being on field or off field. Each component was ranked prior to the test
to reduce the effects of actual value differences. Such multivariate statistics
are commonly applied to geologic and geochemical data when no obvious
two or three-dimensional approach defines the model. Hitchon and Horn
(1974), for example, used similar techniques to differentiate between
brines associated with productive and nonproductive wells in Alberta,
Canada. Similarly, Davis (1973) showed the utility of discriminant analysis
in accentuating differences among data in multivariate (multidimensional)
space. Table 4 illustrates the results of this test conducted on the Geosat
Patrick Draw test site.
Based on the results of the statistical test from each of three soil-gas
analytical techniques, sites situated over production can be differentiated
to a degree from sites located off production. The disaggregate data set
showed the highest degree of discrimination, with 73.44% of the on-production
samples being correctly reclassified as on production. The next highest
degree of correct reclassification was shown by the acid-extraction data
set, in which 69.12% of the on-production sites were reclassified as on
production. The 4-ft (1.2-m) probe data set showed a 64.75% correct on-production
reclassification. Using this approach, the soil-gas techniques used in
this study could be applied to screen out areas of unknown potential.
Given a valid model, workers can easily define prospective areas with
similar hydrocarbon potential to the calibration area.
CONCLUSIONS
The results of the 1983 resampling program of the Geosat Patrick Draw test site suggest that the mode of microseepage in the area is controlled by faults and fractures that provide paths for hydrocarbon gases to migrate from depth to the near surface. Tests of four different surface geochemical techniques yield different expressions at the surface. The observed pattern of anomalous light n-paraffin gases appears to be dependent upon the sampling technique and the mode of analysis used. Although we suggest several possible causes of these relationships, we have reached no definite conclusions. To explain those relationships, additional support data are needed, such as percent clay, mineralogy moisture, soil pH, and soil bacteria. High hydrocarbon values in shallow 4-ft (1.2-m) and 12-ft (3.65-m) free soil gas correlate well with fluorescence and appear to define areas of high production potential with direct anomalies, whereas adsorbed gases (as measured using a thermomechanical disaggregation technique or a commercial acid-extraction technique) are opposite. These sorbed gas methods exhibit magnitude lows over the production at Patrick Draw, which suggests faint halo patterns. Areas of higher value sorbed soil gases may reflect lithologic control or vertical migration from depth along fracture and fault zones. Although sorbed gases, at best, only poorly define areas of production based on value and compositional patterns, the use of multivariate statistics shows that a difference exists between sites situated over production and sites situated away from production. Such differences should make it possible to define other areas of higher hydrocarbon potential by comparing the signals present in areas of unknown potential to areas of a known potential. Finally, the free gas microseeps reported in the 4-ft (1.2-m) and 12-ft (3.65-m) samples at Patrick Draw confirm the presence of a macroseep that appears to be adversely affecting the sage foliage. The stressed foliage may be discerned on airborne remote sensing imagery as spectrally different from areas of healthy, nonaffected foliage. This observation opens the possibility of using remote sensing to pinpoint areas having similar signatures, and hence could aid hydrocarbon exploration in areas of similar geologic and climatic makeup.
SELECTED REFERENCES
Abrams, M.J., J.E. Conel, H. R. Lang, and H. N. Paley, 1985, The joint
NASA/Geosat test case project: final report: AAPG, part 2, v.2, p. 11-6
to 11-7.
Davis, J.C., 1973 Statistics and data analysis in geology: New York, John
Wiley, 550 p.
Donovan, T.J., 1974, Petroleum microseepage at Cement, Oklahoma: evidence
and mechanism: AAPG Bulletin, v. 58, p. 429-446.
______ and M. C. Dalziel, 1977, Late diagenetic indicators of buried oil
and gas: USGS Open-File Report 77-817, 44 p.
Drozd, R.J., G.J. Pazdersky, V.T. Jones, and T.J.. Weismann, 1981, Use
of compositional indicators in prediction of petroleum production potential
(abs.): Proceedings of the 1981 American Chemical Society Annual Meeting,
Atlanta, Georgia, March 29-April 3.
Ferguson, J.D., 1975, Surface alteration and mineralization of Permian
red beds overlying several oil fields in southern Oklahoma: Master's thesis,
Oklahoma State University, Stillwater, Oklahoma, 95 p.
Hitchon, B., and M.K. Horn, 1974, Petroleum indicators in formation waters
from Alberta, Canada: AAPG Bulletin, v. 58, p. 464-473.
Horvitz, L., 1939, On geochemical prospecting: Geophysics, v. 4, p. 210-225.
______ 1959, Geochemical prospecting for petroleum: symposium on geochemical
exploration: 20th International Geological Congress (Mexico City), v.2,
p. 303-319.
______ 1972, Vegetation and geochemical prospecting for petroleum: AAPG
Bulletin, v. 56, p. 925-940.
______ 1985, Near-surface hydrocarbons and nonhydrocarbon gases in petroleum
exploration, in Surface and near-surface geochemical methods in petroleum
exploration: Association of Petroleum Geochemical Explorationists Short
Course, AAPG Rocky Mountain Section Meeting, Denver, Colorado, June 2,
p. D1-D52.
Janezic, G.G., 1979, Role of biogenic light hydrocarbon generation in
near-surface prospecting: AAPG Meeting, Houston, Texas, April 1979.
Jones, V.T., 1983, Surface monitoring of retort gases from an underground
coal gasification reactor: time dynamics (abs.): Proceedings of the 1983
American Chemical Society Annual Meeting, Washington, D.C., September.
______ and R.J. Drozd, 1979, Predictions of oil or gas potential by near-surface
geochemistry (abs.): AAPG Bulletin, v. 63, p. 699.
______ ______ 1983, Predictions of oil or gas potential by near-surface
geochemistry: AAPG Bulletin, v. 67, p. 932-952.
______ and H.W. Thune, 1982, Surface detection of retort gases from an
underground coal gasification reactor in steeply dipping beds near Rawlins,
Wyoming (abs.): Proceedings of the 57th Annual Fall Meeting of the Society
of Petroleum Engineers of AIME, New Orleans, Louisiana, September 26-29.
Laubmeyer, G., 1933, Eine neue geophysikalische Schürfmethode insbesondere
für Kohlenwasserstoff-Lagerstätten: Petroleum, v. 29, no. 18,
p. 1-4.
Matthews, M.D., 1985, Effects of hydrocarbon leakage on earth surface
materials: presented at Symposium 4, Unconventional Methods in Exploration
for Petroleum and Natural Gas, Southern Methodist University, Dallas,
May 1-2.
______ V.T. Jones, and D.M. Richers, 1984, Remote sensing and hydrocarbon
leakage (abs.): Proceedings of the 3rd International Symposium on Remote
Sensing of the Environment, Colorado Springs, Colorado, April, p. 663-670.
McCubbin, D.G., and M.J. Brady, 1969, Depositional environment of the
Almond reservoirs, Patrick Draw field, Wyoming: The Mountain Geologist,
v.6, p. 3-26.
Mousseau, R.J., and J.C. Williams, 1979, Dissolved hydrocarbons in coastal
waters of North America (abs.): AAPG Bulletin, v. 63, p. 699-700.
Paylor, E.D., II, 1983, Investigation of surface features interpreted
from remote sensing data of the Table Rock gas field, Sweetwater County;
Wyoming: PhD dissertation, University of Wyoming, Laramie, Wyoming, 81
p.
Pirkle, R.J., and R.J.. Drozd, 1984, Hydrocarbon contamination in the
near-soil (abs.): Proceedings of the 1984 American Chemical Society Annual
Meeting, St. Louis, Missouri, April 8-13.
Price, V. and A. Heatherington, 1984, The influence of soil/sediment pH
of mineralogy on the absorbed hydrocarbon technique for geochemical exploration
for petroleum (abs.): Proceedings of the 1984 American Chemical Society
Annual Meeting, St. Louis, Missouri, April 8-13.
Richers, D. M., 1984, Comparison of commonly applied soil-gas techniques
used in evaluating hydrocarbon potential (abs.): Proceedings of the 1984
American Chemical Society Annual Meeting, St. Louis, Missouri, April 8-13.
______ 1985, Some methods of incorporating remote sensing and surface
prospecting with hydrocarbon exploration, in Surface and near-surface
geochemical methods in petroleum exploration: Association of Petroleum
Geochemical Explorationists Short Course, AAPG Rocky Mountains Section,
Denver, Colorado, June 2, p. C1-C94.
______ and C. Weatherby, 1985, A continued study of the Patrick Draw test
site, Sweetwater County, Wyoming (abs.): Proceedings of the Fourth International
Symposium on Remote Sensing of the Environment. San Francisco, April 1-4,
p. 132.
______ R. J. Reed, K. C. Horstman, G.D. Michels, R. N. Baker, L. Lundell,
and R. W. Marrs, 1982, Landsat and soil-gas geochemical study of Patrick
Draw oil field, Sweetwater County, Wyoming: AAPG Bulletin, v.66, p. 903-922.
Roehler, H. W, 1977, Geologic map of the Rock Springs uplift and adjacent
areas, Sweetwater County, Wyoming: USGS Open-File Report 77-242.
Sidle, W C., and D. M. Richers, 1985, Geochemical reconnaissance of Cretaceous
inliers in north-central Oregon: AAPG Bulletin, v. 69, p. 412-421.
Sokolov, V A., 1933,The gas survey as a method of prospecting for oil
and gas formations: Technika, NGRI, no. 1 (February).
Teplitz, A. J., and J. K. Rodgers, 1935, Research project DA-51-3(1):
Gulf Research and Development Company, archives location 71-B23, box 14D-34.
Weimer, R. J., 1966, Time-stratigraphic analysis and petroleum accumulations,
Patrick Draw field, Sweetwater County, Wyoming: AAPG Bulletin, v, 50,p.
2150-2175.
Weismann, T.J.., 1980, Developments in geochemistry and their contributions
to hydrocarbon exploration: Proceedings of the 10th World Petroleum Congress,
v. 2, p. 369-386.
Williams, J.C., R.J. Mousseau, and T.J. Weismann, 1981, Correlation of
well gas analysis with hydrocarbon seep data (abs.): Proceedings of the
1981 American Chemical Society Annual Meeting, Atlanta, Georgia, March
29-April 3.
| Home | Exploration Geochemistry Services | Environmental Geochemistry Services |
©2002 Exploration Technologies, Inc.